Matching the Consumer Experience of Real Sugar
Abstract
The Tea company wanted to replace sugar with sweeteners in their tea products without losing the taste their customers expect but had no fast way to know which sweetener would come closest. Using Liquid State Intelligence™, Apoha ran a three-phase study: first confirming the technology could distinguish between complex tea formulations, then identifying which sweeteners behave most like real sugar, and finally demonstrating that sensory outcomes could be predicted from physicochemical data alone, all within a two-week turnaround.
In Collaboration with:
Major UK Beverage Company

About Liquid State Intelligence™
A new class of data: behavourial data
Liquid State Intelligence places a substance under controlled stress and reads how it responds, capturing a unique behavioural fingerprint that reveals how something truly acts, not just what it's made of.
Liquid State Intelligence™ generates a new class of behavioural data that reveals how materials truly compare, giving teams a deeper basis for confident decisions faster that conventional characterisation cannot provide.
The complexity of molecular behaviour within formulations and how processing techniques changes this makes product development slow, costly, risky and hard to predict, conventional techniques can't capture enough of this behaviour at commercial speed. Liquid State Intelligence™ captures complex behavioural data across ingredients, formulations and processing conditions that conventional techniques cannot, enabling faster decisions, greater control over development, and significant reduction in R&D timelines and cost.
In complex beverage formulations, single-component characterisation provides valuable insight into individual ingredients. However, emergent interfacial and viscoelastic behaviours arising from multi-molecular interactions require a whole-system view. Liquid State Intelligence™ builds on established approaches, going further by measuring the system as a whole and resolving behaviours that current methods leave uncharacterised.
Customer Background
The tea company is one of Britain's most recognised tea brands, with a range spanning traditional teas, herbal infusions, and wellness drinks. Like all food and drink companies, they face constant pressure to make their products healthier, such as by reducing sugar, but without changing the taste or quality that customers expect.
The tea company operates in a highly competitive category where product quality is non-negotiable, which means formulation development carries high risk. Currently there is a high dependence on trial-and-error development, with limited visibility into sensory drivers and so consumer experience. With short R&D timelines and a commercial need to reduce sugar, they needed a faster, more confident way to evaluate sweetener alternatives, they need to reduce the sensory panel load, improving the chances of sucess before committing to costly consumer trials and product launches.
The tea company's goal is to match, or get as close as possible to, the consumer experience of real sugar in their products, but using sweeteners. Sweetener selection is not straightforward: price, functionality, and formulation compatibility all interact. Sweeteners and sugars alter the physiochemical properties of a drink formulation, meaning their performance is highly formulation-dependent. They can also interact with other ingredients, affecting how the broader formulation behaves. These effects are exacerbated by the variation between small lab trials and large scale production.
The Challenge
The tea company' immediate challenge is matching the consumer experience of real sugar using sweeteners in their tea based products, but they do not currently have the tools to do this confidently or quickly. There is a high risk to product quality when changing formulation, especially for sugar and sweetener substitution. This risk is further increased going from lab scale to mass production. Sensory data alone does not neutralise this risk, the decision to change a product formulation currently carries a high degree of uncertainty. Current characterisation fails to capture the full picture of the chemical interactions within the formulation, preventing fast effective product innovation.
How Characterisation Was Applied
Each of two tea bases, tropical and fruit, was combined with seven sweeteners and one sugar reference. All sixteen samples were measured in triplicate, each generating a unique behavioural fingerprint.
The three-stage approach was designed to build confidence systematically, first testing if the Liquid State Intelligence™ could distinguish between complex, similar formulations, then validating that its fingerprint features aligned with the tea company' existing consumer panel data finally demonstrating fast measurement turnaround to fit with the tea company short R&D timelines. This ensured the results included in both physiochemical properties and sensory evidence before any formulation decisions were made.
Multiple key features were identified and extracted within those fingerprints, and the patterns in those features were then compared against the tea company's existing consumer panel data to see how well the two aligned.
This full characterisation was completed in 2 weeks, demonstrating that meaningful physicochemical and sensory insights can be delivered within commercial R&D timelines.
Rather than running consumer tests on every candidate, the tea company could use Liquid State Intelligence™ to screen the full sweetener set in a single study, reducing the time and cost of reaching a confident shortlist.
For Figures 1 & 2: The VIBE fingerprint generates high-dimensional data across multiple optical channels. The optical channels help in tracking the evolution of the waves, and the VIBE is a metric derived from that. Features are extracted from each fingerprint and each sample is represented as a single point in three-dimensional feature spaceo, samples with similar behavioural profiles cluster together, dissimilar ones sit further apart. Silhouette analysis was used to quantify the degree of separation between clusters, providing a statistical measure of how distinct each formulation group is from the others.
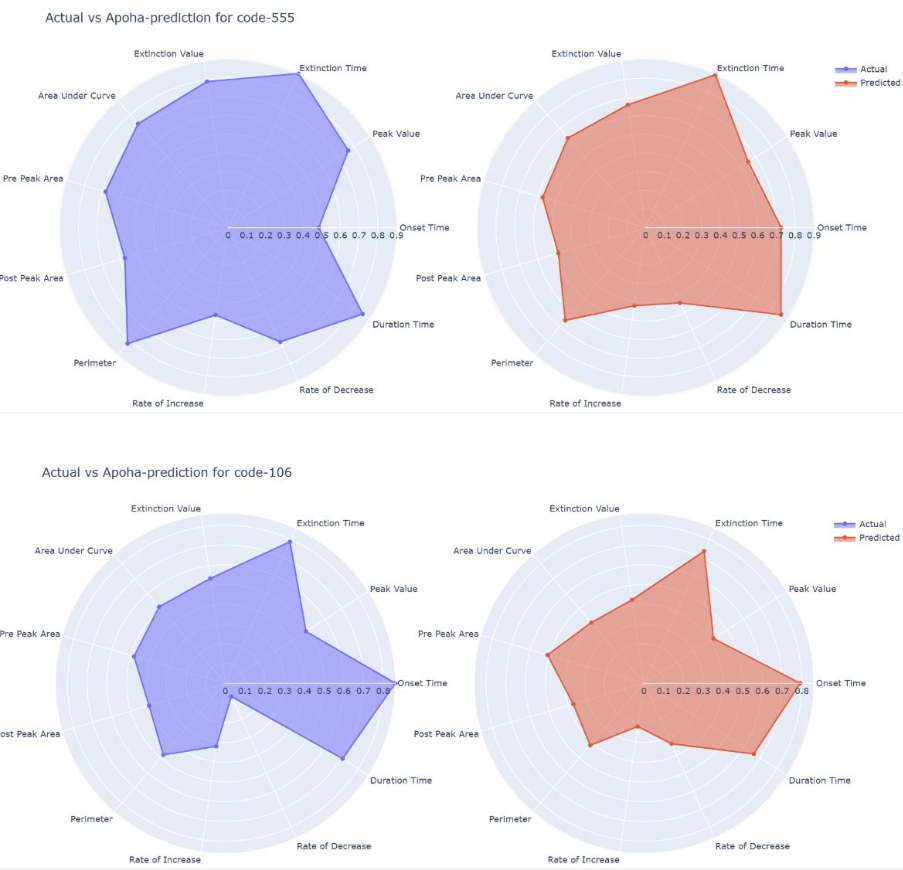
For Figure 3: The full dataset of fingerprint features was correlated against the tea company' consumer panel data, both QDA and Time-Intensity profiles, to identify which features showed the strongest alignment with sensory outcomes. A predictive model was then built from these correlations and used to predict the sensory profile of each sample. Predicted profiles were compared against the actual consumer panel scores to assess how closely the Liquid State Intelligence™ fingerprint could replicate the sensory data.
Results, Outcomes and Key Data
Liquid State Intelligence™ could reliably tell different tea formulations apart, even when tested across eight different sweeteners. The technology distinguished between the products consistently, showing it works on complex finished drinks, not just simple ingredients.
This means Liquid State Intelligence™ can test whole formulations directly, without needing to break them down into individual components and rebuild them. That saves significant time and cost in the development process.
Liquid State Intelligence™ can distinguish between complex tea formulations
Figure 1 shows distinct clustering of samples by tea type, tropical tea with sweetener, fruit tea with sweetener, pure sweetener, and fruit tea with sugar, with concentrations held constant. Eight sweeteners were tested with three repeats each. Rather than a random distribution, each tea type forms a distinct cluster. The tea's interaction with a sweetener is the dominant driver of the signal, with the choice of sweetener acting as a secondary driver, visible in the variation within each cluster. This demonstrates that Liquid State Intelligence™ can distinguish between these complex, similar formulations even across a range of sweeteners.
Two additional findings emerge from Figure 1: This demonstrates that Liquid State Intelligence™ detects behavioural differences driven by the complexity of the whole formulation, not just the molecular makeup of individual ingredients. And when comparing the eight sweeteners in tropical vs fruit tea, fruit tea shows a greater spread of behaviour, indicating that sweeteners interact differently with fruit tea than with tropical tea. This demonstrates that Liquid State Intelligence™ detects behavioural differences driven by ingredient interactions, not just individual molecular properties.
Liquid State Intelligence™ detected meaningful differences between tea with sugar and tea with sweetener, a necessary capability for identifying which sweetener comes closest to the consumer experience of real sugar. This demonstrates the technology can be used to guide material replacement decisions.
Some sweeteners are closer to real sugar than others Figure 2 shows that sugar and sweetener in the same tea base produce different behavioural profiles. A subset of sweetener samples cluster closer to the sugar reference, identifying these as the strongest candidates for matching the consumer experience of real sugar.
In the previous analysis, samples were compared as a whole, revealing how they cluster and separate. Here, we break down the differences driving that separation into individual Liquid State Intelligence™ fingerprint features, quantify them, and map each one to specific dimensions of the tea company' sensory data.
Liquid State Intelligence™ fingerprint features were mapped to the tea company' sensory data and used to predict the sensory profile of each sample. These predictions showed comparable shapes to the actual sensory profiles, indicating the potential to use Liquid State Intelligence™ to reduce reliance on costly and time-consuming consumer sensory testing.
Liquid State Intelligence™ features correlate with the tea company' sensory data Figure 3 compares actual sensory data from the tea company' consumer panel(in blue/left) against sensory profiles predicted from the Liquid State Intelligence™ fingerprint (in red/right) . Significant features from the fingerprint were correlated against sensory data from the 8 samples provided by the tea company, mapping fingerprint features to sensory properties. The predicted sensory profiles showed strong alignment with the tea company' consumer panel data, demonstrating that Liquid State Intelligence™ features encode meaningful sensory information.
.png)
.png)
Next Steps
Following the success of this study, the tea company and Apoha are moving into the next phase of collaboration, applying Liquid State Intelligence™ to accelerate testing by reducing sensory testing across a wider range of products and markets. A separate study mapping black tea blends for rapid blending decisions is also currently being finalised.
The next phase focuses on two goals: building a physicochemical landscape of the tea company's product range and competitor products, and using that landscape to fast-track reformulation decisions before committing to costly consumer panel time. The ambition is to reduce sensory testing timelines from weeks to days.