Real-Time Antibody Biophysical Monitoring Across a 14-Day Production Cycle
Abstract
For every batch of a biological medicine, manufacturers wait up to 14 days before knowing if the product is good. This study shows it is possible to track how the antibody is developing every single day, and compare it to the target reference in real time, opening the door to earlier decisions, faster intervention, and significant cost savings.
In Collaboration with:
.svg)
~8
µg per daily readout
14
day production cycle
4
antibody batches tracked
label-free
native-state readout
How To Read This
This case study contains two investigations. Sections 1 and 2 are shared. From Section 3 onward, each investigation is presented as a separate track.
Investigation 1
Bioprocess Monitoring: Four antibodies sampled daily across a 14-day production cycle, each measured at 0.1 mg/mL in PBS, can Liquid State Intelligence™ detect biophysical changes as the antibody matures, and identify when the product reaches its final form, even if that's before Day 14?
Investigation 2
Biosimilar Comparability: Three batches of Omalizumab sampled daily across the same cycle, compared against Xolair (innovator), does the production trajectory, not just the endpoint, match the innovator?
About Liquid State Intelligence™
Liquid State Intelligence™ is Apoha's measurement platform for capturing how molecules behave under real-world stresses, where performance actually matters. Most tools measure one isolated property at a time. Liquid State Intelligence delivers a small sample onto a specially engineered liquid surface and reads the waves that result, delivering a behavioural picture of that molecule in a single measurement, from as little as 10µg of material.
Developability failures happen late because early-stage tools don't capture the full picture of how a molecule will behave under real conditions. Liquid State Intelligence gives R&D teams a single high-dimensional readout sensitive to aggregation tendency, hydrophobicity, stability, and more, from one measurement, as early as hit identification. Apoha's platform eliminates candidates destined to fail with high precision, so the molecules that continue down the development pipeline are the ones most likely to reach patients.
Applied to antibodies, each droplet impact subjects the molecules to a transient, high-shear coalescence event that simultaneously imposes interfacial expansion, Marangoni-driven surface compression, axial elongational flow, and a sharp chemical-potential gradient, a single mechanically and chemically resolved probe of behaviours linked to aggregation, surface activity, viscosity and self-association.
Customer Background
Somru Bioscience is a biopharmaceutical CDMO specialising in biosimilar development. This collaboration combines Somru's production and bioanalytical capabilities with Apoha's biophysical fingerprinting to develop next-generation comparability and PAT (Process Analytical Technology - tools that monitor the product in real time during manufacturing) tools.
Somru Bioscience is a Canadian contract research organisation founded in 2012 and based in Prince Edward Island. The company specialises in biosimilar development and bioanalytical services, serving pharmaceutical and biotechnology partners across North America and Europe, a market it expanded into following a 15,000-square-foot facility growth in 2023.
For a CRO competing on the quality and depth of its characterisation capabilities, access to better tools for monitoring antibody behaviour during production is a direct commercial advantage, both for internal process development and as a differentiator when attracting biosimilar clients.
Traditional bioprocess monitoring tracks the environment: pH, dissolved oxygen, glucose consumption, viable cell density. These are informative but they describe the conditions of production, not the state of the product. For biosimilar developers, the challenge goes further. A biosimilar must match the innovator in its final form, but during production, the antibody evolves. If you only measure comparability at the end of the process, you have no visibility into whether your production conditions are driving the molecule toward the innovator's biophysical character, or away from it.
The Challenge
You Know What Your Bioreactor Is Doing. But Do You Know How Your Antibody Is Developing?
If the antibody drifts in glycosylation profile, conformational stability, or aggregation propensity during the culture, you typically discover it during end-product characterisation, after 14 days of resource, production time, and expenditure. A batch that arrives at the right endpoint through the wrong trajectory may be unstable; small process perturbations could push it off course.
Standard bioprocess characterisation tools, SEC, icIEF, glycan analysis, require purified material and are applied at the end of the production cycle. They also demand sample volumes that are impractical for daily sampling, particularly at development scale where material is limited. During the 14-day bioreactor run itself, no tool measures the antibody directly. The monitored parameters describe the culture environment, not the product. Whether the antibody is maturing correctly, accumulating aggregates, or drifting from the innovator's biophysical profile is simply not visible until the batch is complete, at which point intervention is no longer possible, and the full cost of the run has already been incurred.
"There's monitoring of the bioreactor itself: pH, temperature, glucose levels. But not the product. Nobody is monitoring the drug itself during the process. For each batch, you have to wait until it's completed to find out if it's good or not. That's a lot of money and a lot of wasted time"
How Characterisation Was Applied
Three batches of Omalizumab biosimilar were sampled daily across a 14-day bioreactor cycle and measured alongside the Omalizumab innovator, tracking how closely each batch's production trajectory matched the reference, day by day.
Rather than comparing biosimilar to innovator only at the final purified product stage, this investigation applied Liquid State Intelligence™ daily, turning comparability from a single end-point verdict into a real-time trajectory that can guide process development and flag divergence early.
Each daily measurement requires ~8 μg of normalised sample (80 μL at 0.1 mg/mL). Samples are collected directly from the bioreactor and undergo a protein isolation step before measurement. The readout is a complete behavioural fingerprint, see Figure 1, label-free, in native buffer, with no specialised sample preparation beyond a one-step purification and concentration normalisation. A full 14-day trajectory with triplicates consumes less than 0.5 mg of total protein, compatible with small-scale and pilot bioreactor runs where material is limited.
Somru provided Omalizumab from three production batches (Control Batch 1, Control Batch 2, Control Batch 3), harvested daily across a 14-day bioreactor cycle. Xolair (innovator) was included as the biosimilarity reference. All samples were normalised to 0.1 mg/mL in PBS before measurement. Sirukumab and Trastuzumab were included as antibody controls in each run. Batches 061 and 062 have complete 15-day trajectories (Days 0–14).
Results, Outcomes and Key Data
The VIBE fingerprint of harvested antibody changes systematically across the production cycle, with a reproducible three-phase trajectory, early, transition, plateau, observed across four batches of three different antibodies. The measurement is sensitive enough to resolve daily changes in product character from ~8 μg of normalised material.
All three biosimilar batches follow a reproducible maturation trajectory, and all three finish Day 14 with a consistent, quantifiable biophysical gap to the Xolair innovator. The gap is visible daily, not just at the endpoint.
Batch-to-batch production trajectories are reproducible Control Batches 1 and 2 show highly similar trajectories, the evolution across days is reproducible between batches, indicating the production process itself drives a consistent maturation pattern.
The fingerprint evolves systematically across the production cycle The antibody harvested on Day 1 is not biophysically the same molecule as the antibody harvested on Day 14, even though both are Rituximab, at the same concentration, in the same buffer. The VIBE vector captures a change: glycosylation heterogeneity, host cell protein content, aggregate populations, conformational maturation, or some combination of these. The measurement does not identify the mechanism, it detects the change.
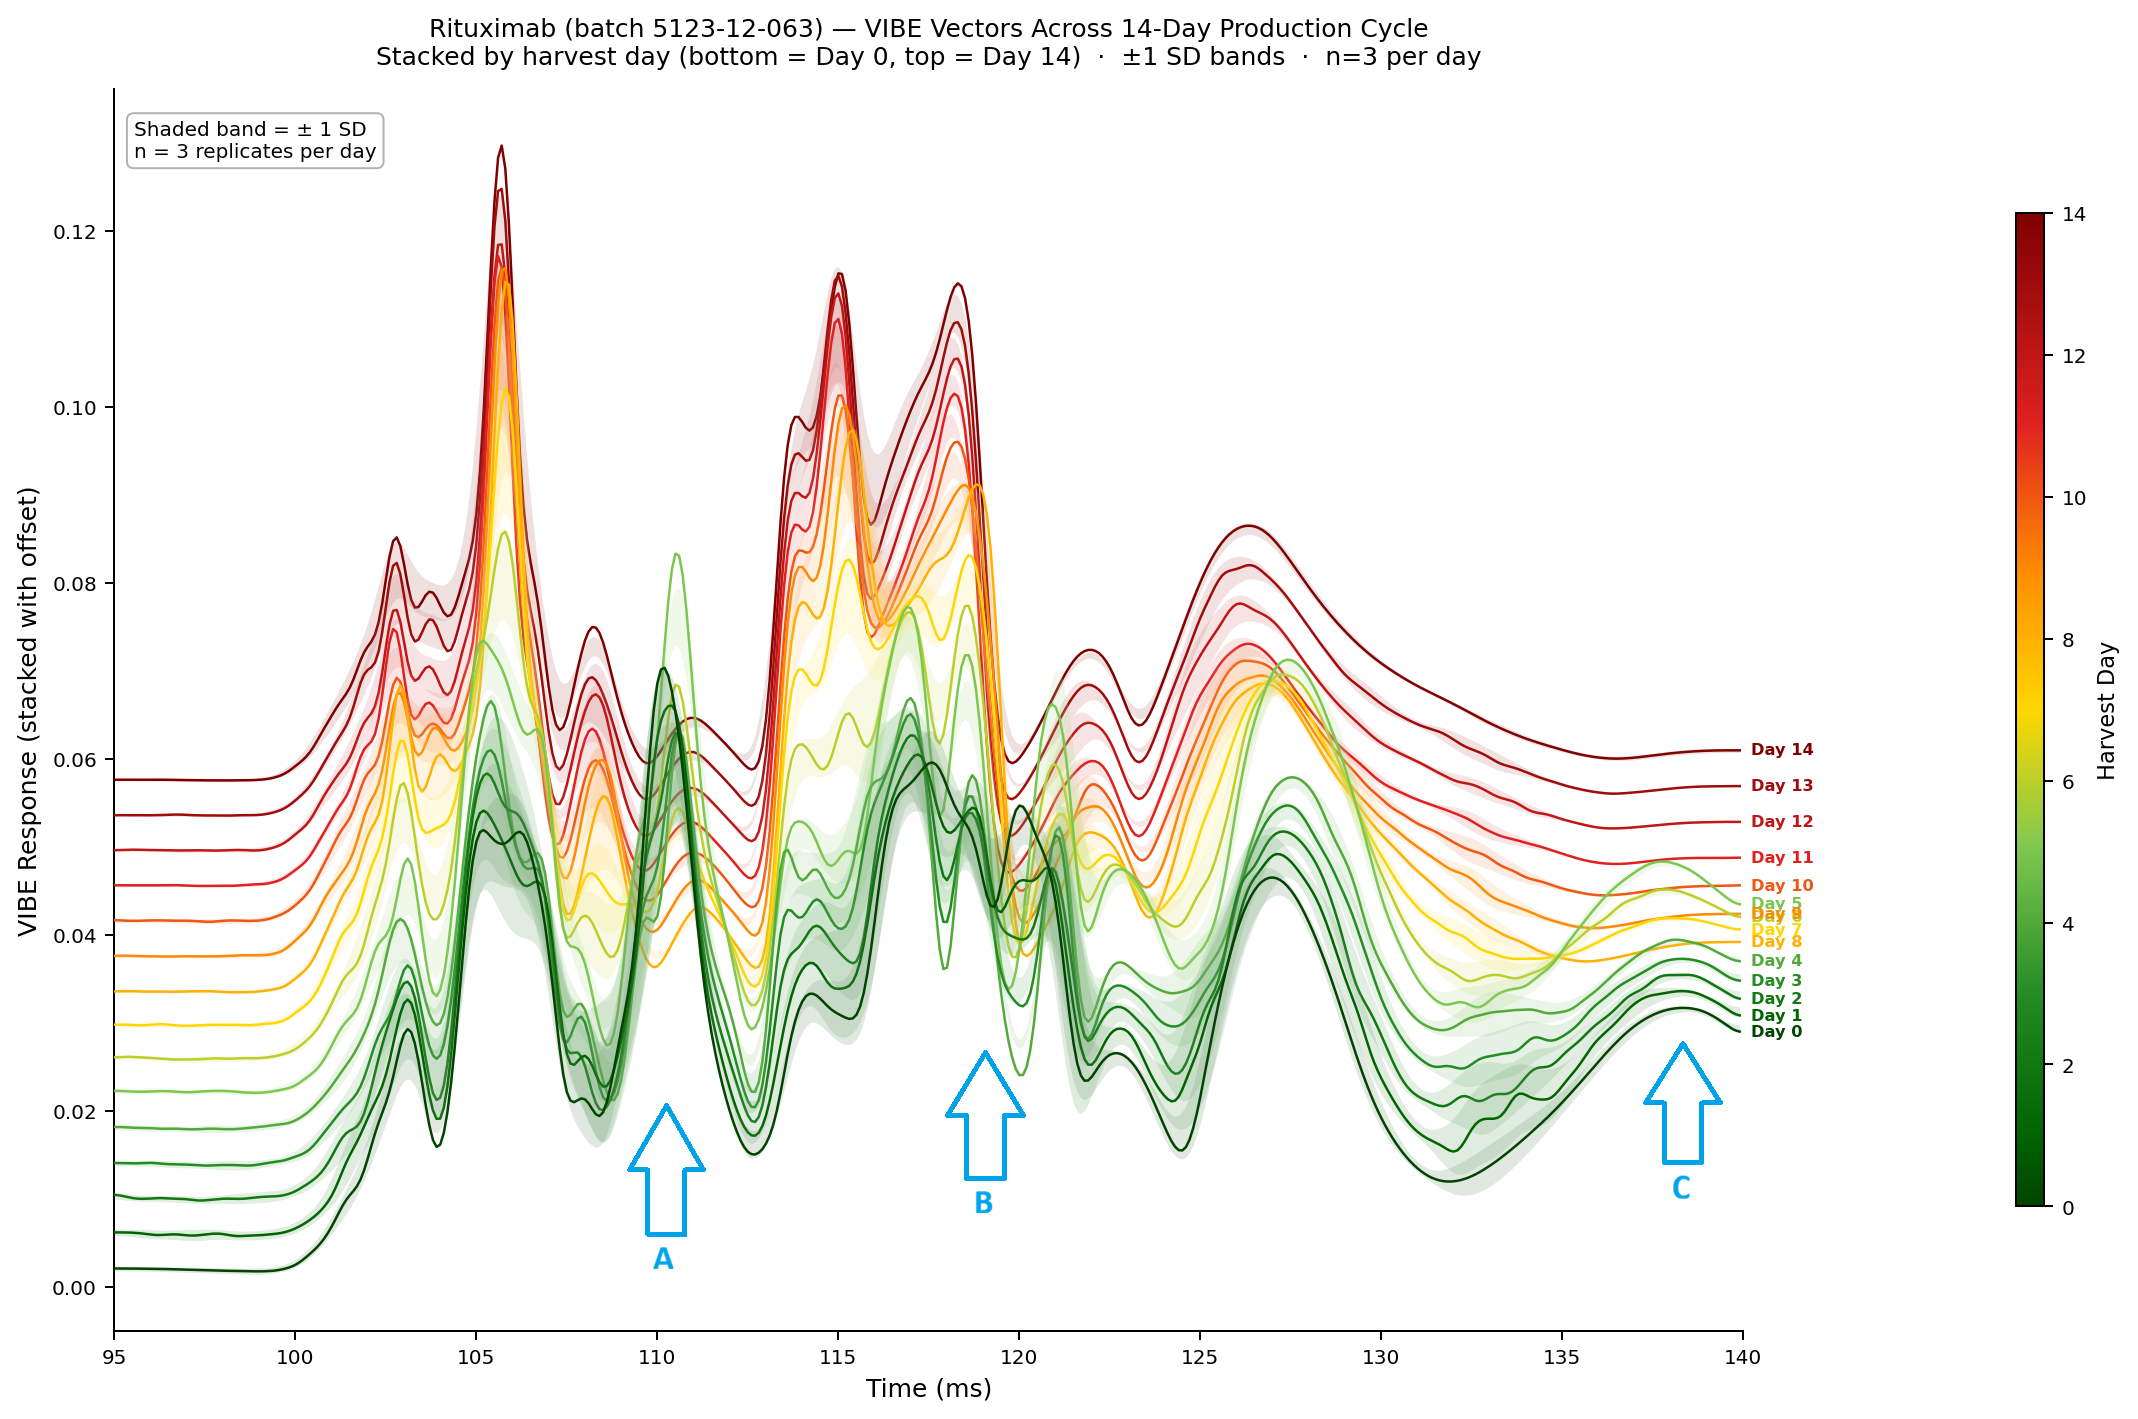
The late-harvest vectors (Days 8–14, red/orange) are notably consistent with each other compared to the earlier days, most visible in the 115–120 ms region, (Figure 1–B) where the waveforms closely align. The first days of harvest also show a higher amplitude in this region. There is a green peak at ~110 ms (Figure 1–A) in the early harvest days that reduces to low amplitude rapidly around Day 4, and the peak at 135 ms disappears
(Figure 1–C). From Day 5 onward, the vectors progressively evolve: the overall amplitude decreases and the shape shifts. By approximately Day 8–10, the vector shape stabilises, Days 10–14 are visually similar to each other but clearly distinct from Days 0–4.
Three production phases resolved, including a plateau that signals product maturity The VIBE, the weighted-average time position of the VIBE vector, provides a single, transparent number that allows you to track the production trajectory. It requires no feature engineering: it is the "centre of mass" of the waveform, traceable by eye in the waterfall above.
The VIBE drops from ~0.026 (Days 0–3) to ~0.014 (Days 10–14), well outside the replicate variability at each time point. The trajectory shows three phases:
• Days 0–4 - Early production. High VIBE, high variability. The product is biophysically immature, the harvest contains a heterogeneous mixture whose behavioural fingerprint is distinct from the final product.
• Days 5–9 - Transition. The VIBE drops through an inflection. The product character is actively changing. A step-like shift occurs around Day 5–6.
• Days 10–14 - Plateau. The VIBE stabilises. The antibody has reached its mature biophysical state. Subsequent harvest days produce material that is behaviourally consistent.
This three-phase pattern was observed across all four antibody batches tested (two Omalizumab batches, one Palivizumab, one Rituximab), see Investigation 2, Figure 2. The timing of the transition varies by molecule and batch, but the qualitative structure is consistent.
Real-time detection enables real-time decisions A bioprocess monitoring tool does not need to explain why something changed to be operationally valuable. If the VIBE trajectory for a new batch deviates from the established baseline at Day 4, that deviation is a signal, regardless of whether it reflects glycosylation drift, aggregation, or HCP contamination. The appropriate response is the same: investigate. The value is in detecting the deviation early enough to act. This could then evolve into a self-regulating reactor, adjust media, other conditions, and shorten production timelines as the final product may be fully developed days before the harvest.
Liquid Brain perturbs the antibody at a controlled air–liquid interface and captures the relaxation response as a time-resolved waveform. The perturbation couples interfacial adsorption, viscoelasticity, and solute–solvent reorganisation. The resulting fingerprint
reflects the complex biophysical character of whatever is in solution, it does not isolate a single molecular property. During a 14-day antibody production cycle, many things change simultaneously: titre increases, glycosylation patterns evolve, host cell protein and DNA content shifts, aggregate populations change, and the antibody itself may undergo conformational maturation as post-translational modifications accumulate. All samples in this study were normalised to 0.1 mg/mL before measurement, removing titre as a variable. The remaining factors, glycosylation, aggregation, HCP content, and conformational heterogeneity, are all potential contributors to the observed VIBE trajectory. Attributing the VIBE signal to a specific mechanism requires correlation with orthogonal characterisation data, SEC, icIEF, glycan analysis, HCP ELISA, which is the next phase of this collaboration. Somru's bioanalytical data for these same samples will be analysed alongside the VIBE data to identify which quality attributes correlate most strongly with the behavioural fingerprint.
The fingerprint evolves systematically across the production cycle The antibody harvested on Day 1 is not biophysically the same molecule as the antibody harvested on Day 14, even though both are Rituximab, at the same concentration, in the same buffer. The VIBE vector captures a change: glycosylation heterogeneity, host cell protein content, aggregate populations, conformational maturation, or some combination of these. The measurement does not identify the mechanism, it detects the change.
The late-harvest vectors (Days 8–14, red/orange) are notably consistent with each other compared to the earlier days, most visible in the 115–120 ms region, (Figure 1–B) where the waveforms closely align. The first days of harvest also show a higher amplitude in this region. There is a green peak at ~110 ms (Figure 1–A) in the early harvest days that reduces to low amplitude rapidly around Day 4, and the peak at 135 ms disappears
(Figure 1–C). From Day 5 onward, the vectors progressively evolve: the overall amplitude decreases and the shape shifts. By approximately Day 8–10, the vector shape stabilises, Days 10–14 are visually similar to each other but clearly distinct from Days 0–4.
Three production phases resolved, including a plateau that signals product maturity The VIBE, the weighted-average time position of the VIBE vector, provides a single, transparent number that allows you to track the production trajectory. It requires no feature engineering: it is the "centre of mass" of the waveform, traceable by eye in the waterfall above.
The VIBE drops from ~0.026 (Days 0–3) to ~0.014 (Days 10–14), well outside the replicate variability at each time point. The trajectory shows three phases:
• Days 0–4 - Early production. High VIBE, high variability. The product is biophysically immature, the harvest contains a heterogeneous mixture whose behavioural fingerprint is distinct from the final product.
• Days 5–9 - Transition. The VIBE drops through an inflection. The product character is actively changing. A step-like shift occurs around Day 5–6.
• Days 10–14 - Plateau. The VIBE stabilises. The antibody has reached its mature biophysical state. Subsequent harvest days produce material that is behaviourally consistent.
This three-phase pattern was observed across all four antibody batches tested (two Omalizumab batches, one Palivizumab, one Rituximab), see Investigation 2, Figure 2. The timing of the transition varies by molecule and batch, but the qualitative structure is consistent.
Real-time detection enables real-time decisions A bioprocess monitoring tool does not need to explain why something changed to be operationally valuable. If the VIBE trajectory for a new batch deviates from the established baseline at Day 4, that deviation is a signal, regardless of whether it reflects glycosylation drift, aggregation, or HCP contamination. The appropriate response is the same: investigate. The value is in detecting the deviation early enough to act. This could then evolve into a self-regulating reactor, adjust media, other conditions, and shorten production timelines as the final product may be fully developed days before the harvest.
Liquid Brain perturbs the antibody at a controlled air–liquid interface and captures the relaxation response as a time-resolved waveform. The perturbation couples interfacial adsorption, viscoelasticity, and solute–solvent reorganisation. The resulting fingerprint
reflects the complex biophysical character of whatever is in solution, it does not isolate a single molecular property. During a 14-day antibody production cycle, many things change simultaneously: titre increases, glycosylation patterns evolve, host cell protein and DNA content shifts, aggregate populations change, and the antibody itself may undergo conformational maturation as post-translational modifications accumulate. All samples in this study were normalised to 0.1 mg/mL before measurement, removing titre as a variable. The remaining factors, glycosylation, aggregation, HCP content, and conformational heterogeneity, are all potential contributors to the observed VIBE trajectory. Attributing the VIBE signal to a specific mechanism requires correlation with orthogonal characterisation data, SEC, icIEF, glycan analysis, HCP ELISA, which is the next phase of this collaboration. Somru's bioanalytical data for these same samples will be analysed alongside the VIBE data to identify which quality attributes correlate most strongly with the behavioural fingerprint.

How Characterisation Was Applied
The VIBE fingerprint of harvested antibody changes systematically across the production cycle, with a reproducible three-phase trajectory, early, transition, plateau, observed across four batches of three different antibodies. The measurement is sensitive enough to resolve daily changes in product character from ~8 µg of normalised material.
The antibody harvested on Day 1 is not biophysically the same molecule as the antibody harvested on Day 14, even though both are Rituximab, at the same concentration, in the same buffer. The VIBE vector captures a change: glycosylation heterogeneity, host cell protein content, aggregate populations, conformational maturation, or some combination of these.
A bioprocess monitoring tool does not need to explain why something changed to be operationally valuable. If the VIBE trajectory for a new batch deviates from the established baseline at Day 4, that deviation is a signal, regardless of whether it reflects glycosylation drift, aggregation, or HCP contamination. The appropriate response is the same: investigate. The value is in detecting the deviation early enough to act.
This could then evolve into a self-regulating reactor, adjust media, other conditions, and shorten production timelines as the final product may be fully developed days before the harvest.
The fingerprint evolves systematically across the production cycle. The late-harvest vectors (Days 8–14, red/orange) are notably consistent with each other compared to the earlier days, most visible in the 115–120 ms region where the waveforms closely align. The first days of harvest also show a higher amplitude in this region. There is a green peak at ~110 ms in the early harvest days that reduces to low amplitude rapidly around Day 4, and the peak at 135 ms disappears. From Day 5 onward, the vectors progressively evolve: the overall amplitude decreases and the shape shifts. By approximately Day 8–10, the vector shape stabilises, Days 10–14 are visually similar to each other but clearly distinct from Days 0–4.
Liquid State Intelligence™ perturbs the antibody at a controlled air–liquid interface and captures the relaxation response as a time-resolved waveform. The perturbation couples interfacial adsorption, viscoelasticity, and solute–solvent reorganisation. The resulting fingerprint reflects the complex biophysical character of whatever is in solution, it does not isolate a single molecular property. During a 14-day antibody production cycle, many things change simultaneously: titre increases, glycosylation patterns evolve, host cell protein and DNA content shifts, aggregate populations change, and the antibody itself may undergo conformational maturation as post-translational modifications accumulate.
Results, Outcomes & Key Data
All three biosimilar batches follow a reproducible maturation trajectory, and all three finish Day 14 with a consistent, quantifiable biophysical gap to the Xolair innovator. The gap is visible daily, not just at the endpoint.
Control Batches 1 and 2 show highly similar trajectories, the evolution across days is reproducible between batches, indicating the production process itself drives a consistent maturation pattern.
All three batches show the same qualitative evolution: a higher-amplitude, more structured VIBE vector at early harvest days that progressively shifts toward a lower amplitude, altered shape by Day 14. The Xolair innovator (purple dashed) sits distinctly below the Day 14 profiles of all three batches, visible by eye in each panel. If you compare the lightest yellow and darkest red, the VIBE vector shape at Day 1 is clearly different from Day 14. The product is biophysically evolving throughout the 14-day cycle, and the measurement resolves daily changes.
A systematic, quantifiable gap to the innovator persists at Day 14 Even at Day 14, the production batches have not converged to the Xolair innovator profile. The gap is consistent across all three batches, suggesting a systematic difference rather than random batch variation. Critically, the gap can indicate another step is needed rather than necessarily a production failure, the innovator is a finished, purified product; the
production samples are crude harvests that have not undergone downstream purification.
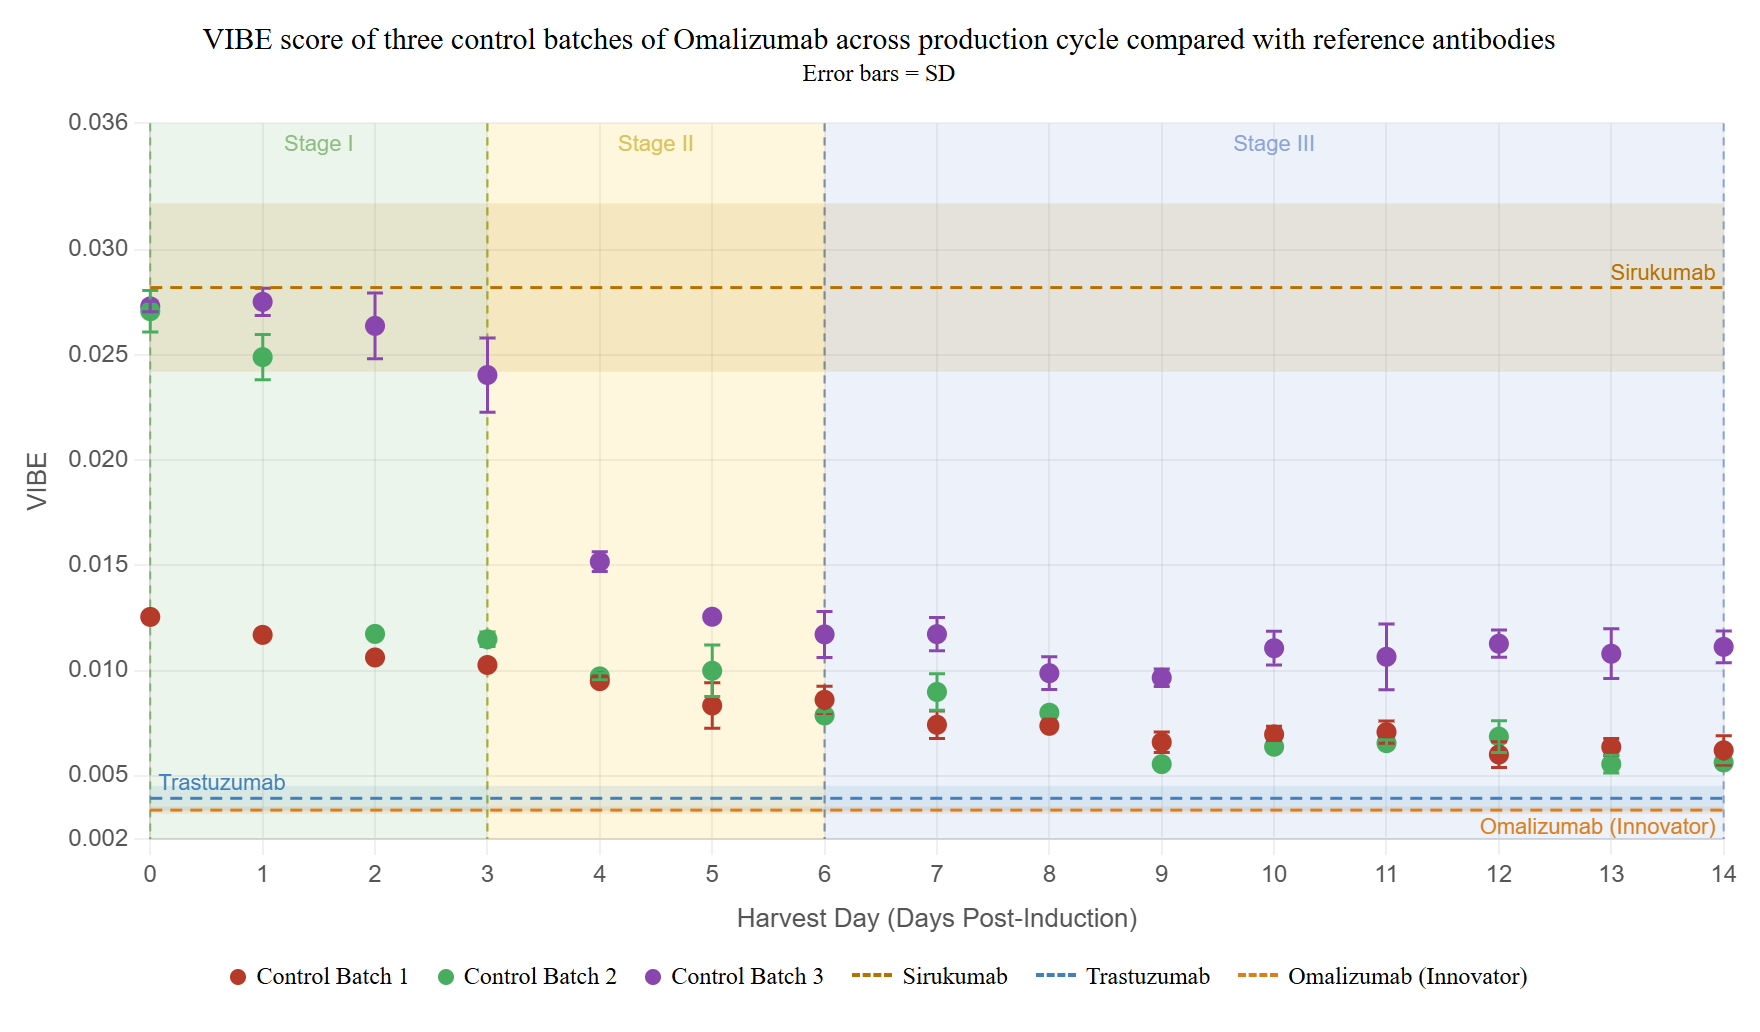
The VIBE score makes the trajectory quantitative and enables us to see the convergence clearly. Control Batch 1 starts at a VIBE score of 0.0125 and follows a distinct trajectory from Day 0. Control Batch 2 shows an early decrease at Day 2, while Control Batch 3 begins its decrease at Day 4, both subsequently converging toward a similar plateau. Control Batch 3 ends Day 14 furthest from the Xolair innovator. The gap is consistent across all three batches, well outside replicate variability, and could reflect differences in glycosylation maturity, aggregate populations, host cell protein content, or cell-line-specific post-translational modifications. The VIBE measurement detects the difference; it does not identify its molecular origin. Some or all of the observed offset may be eliminated by purification, comparing the VIBE fingerprint before and after downstream processing is a natural next step.
Real-time comparability opens new operational possibilitiesTraditionalbiosimilar comparability is assessed on the final purified product. By the timeyou know the answer, the batch is complete, it's too late to fix most issues.This data shows that Liquid State Intelligence™ can resolve biophysicaldifferences during production, opening several operational possibilities:
- Compare reactor conditions in real time. If two process variants produce different VIBE trajectories, you can see the divergence within days, not weeks. This allows rapid screening of process parameters (media composition, feeding strategy, temperature shifts) by their effect on the product's biophysical maturation.
- Detect batch deviations early. With established baseline trajectories (Control Batches 2 and 3 show what "normal" looks like), a future batch that deviates at Day 4 can be flagged immediately rather than discovered at end-product testing.
- Track convergence to the innovator. The persistent gap to Xolair provides a quantitative target. Process optimisation can be assessed by whether it narrows this gap, measured daily, from ~8 µg of normalised sample.
- The centroid trajectories in this study indicate that biophysical maturation plateaus before the end of the 14-day cycle. For Omalizumab (Control batches 2 and 3), the plateau is reached at approximately Days 10–11, suggesting the harvest window could potentially be shortened without compromising product character. A separate antibody in Investigation 1 shows a plateau as early as Day 9.
All three batches show the same qualitative evolution: a higher-amplitude, more structured VIBE vector at early harvest days that progressively shifts toward a lower-amplitude, altered shape by Day 14. The Xolair innovator (purple dashed) sits distinctly below the Day 14 profiles of all three batches, visible by eye in each panel.
The VIBE score makes the trajectory quantitative and enables us to see the convergence clearly. Control Batch 1 starts at a VIBE score of 0.0125 and follows a distinct trajectory from Day 0. Control Batch 2 shows an early decrease at Day 2, while Control Batch 3 begins its decrease at Day 4, both subsequently converging toward a similar plateau. Control Batch 3 ends Day 14 furthest from the Xolair innovator.
The gap is consistent across all three batches, well outside replicate variability, and could reflect differences in glycosylation maturity, aggregate populations, host cell protein content, or cell-line-specific post-translational modifications. The VIBE measurement detects the difference; it does not identify its molecular origin. Some or all of the observed offset may be eliminated by purification, comparing the VIBE fingerprint before and after downstream processing is a natural next step.
A Systematic, Quantifiable Gap to the Innovator Persists at Day 14
Even at Day 14, the production batches have not converged to the Xolair innovator profile. The gap is consistent across all three batches, suggesting a systematic difference rather than random batch variation. Critically, the gap can indicate another step is needed rather than necessarily a production failure, the innovator is a finished, purified product; the production samples are crude harvests that have not undergone downstream purification.

Next Steps
This study is the first release from an ongoing collaboration between Apoha and Somru Bioscience, supported by a joint grant to develop a high-resolution Process Analytical Technology (PAT) framework. Together, the two investigations establish that the biophysical state of the antibody can be tracked daily during production and compared in real time against an innovator reference. If you can observe that state continuously, you can use that observation to adjust process parameters, closing the loop on bioreactor control.
Establish batch-to-batch baselines. With multiple batches per molecule already measured, we can begin to define what a normal VIBE trajectory looks like and set deviation thresholds for early intervention.
Correlate VIBE trajectories with quality attributes. Somru's bioanalytical characterisation, HIC, AC-SINS, BVP assays, SEC, icIEF, glycan analysis, potency assays, for these same samples will be mapped against the VIBE data to identify which quality attributes drive the observed trajectory and the gap to the innovator.
Establish batch-to-batch baselines. With multiple batches per molecule already measured, we can begin to define what a normal VIBE trajectory looks like and set deviation thresholds for early intervention.
If on day three we saw that target binding was completely off, and we knew that was a key indicator that wouldn't change no matter what we did, we'd scrap it. You're potentially saving up to a month. You're saving all the supporting reagents, and if we're talking a 500-litre bioreactor, you've saved the acid, the personnel, everything that adds up to millions of dollars per batch.
— Somru Bioscience

.svg)